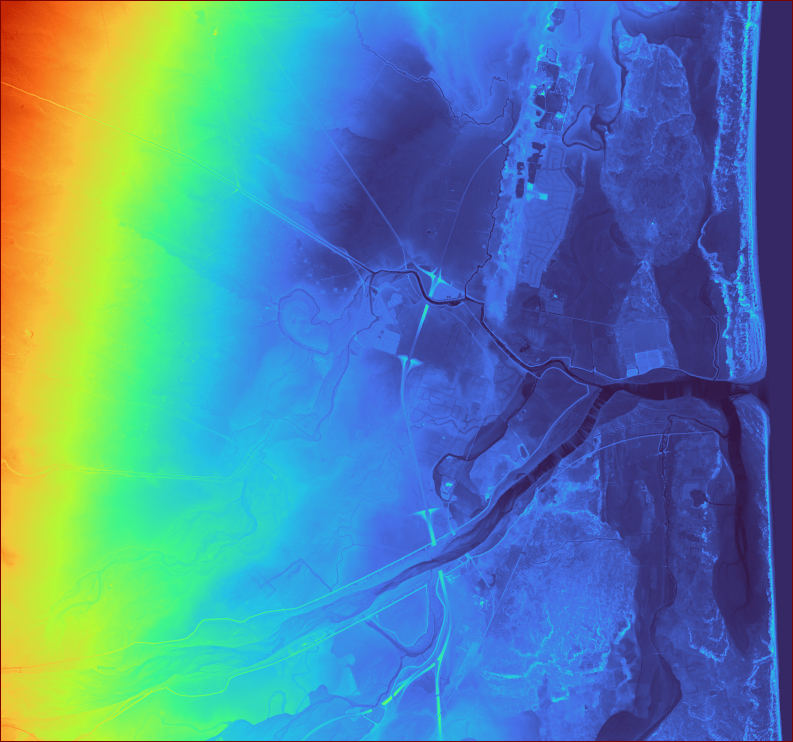
16-metre resolution Digital Elevation Model of the study area showing topographic variation. The DEM was obtained from regional survey data and georeferenced to NZGD2000. This DEM forms the foundation for hydraulic modelling, defining the flow pathways and water storage capacity of the landscape.
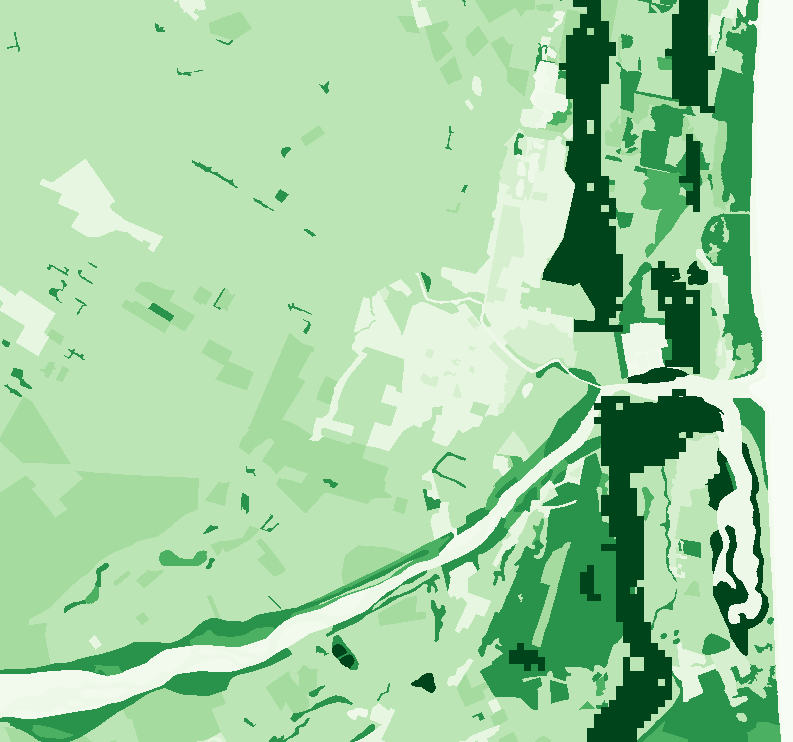
Spatially variable Manning’s n coefficients derived from the Land Cover Database (LCDB) v5.0. Each land cover class was assigned roughness values ranging from 0.0113 (bare ground/water) (light green) to 0.40 (dense forest/wetland) (dark green). Manning coefficients represent surface friction and resistance to flood flow. Higher values indicate greater flow resistance (e.g., vegetated areas), while lower values indicate smoother surfaces (e.g., water bodies, developed areas). This layer directly influences flood extent and flood velocity predictions in the hydraulic model.
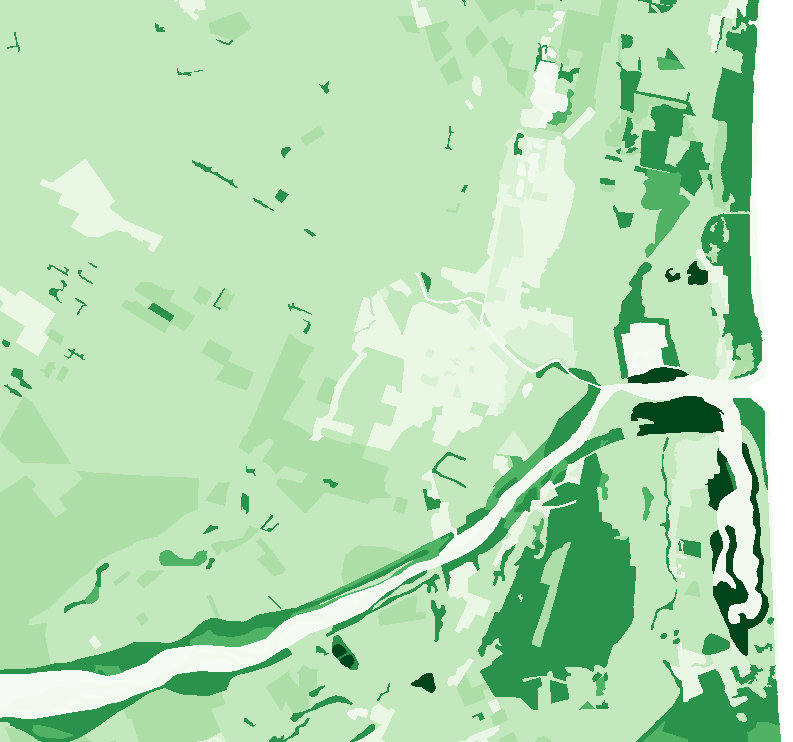
Wetland extent map (shaded area) overlaid on the Manning coefficients layer. The original wetland vector was georeferenced using ground control points, extracted, and merged with the rasterised LCDB. Pixels within the clipped wetland extent were assigned a Manning value of 0.4 to represent enhanced vegetation and flow resistance of restored wetlands. This modification allows direct comparison between baseline (existing wetlands) and enhanced wetland scenarios in flood modelling.

Flood depth map (in metres) from a representative timestep in the LISFLood-FP 2.0 simulation. The model solved the 2D shallow-water equations on an 8-metre grid over a 4-hour simulation. Darker blue indicates greater depths.
(The image quality is better if opened on YouTube and then set to 1080p)
Three-panel animation comparing flood dynamics across scenarios: (a) Baseline, (b) Downstream Wetland, and (c) Upstream Wetland. Each panel displays time-series flood depth maps at 10-minute intervals over the 4-hour simulation. The animation reveals distinct differences in flood extent, depth, and propagation speed between scenarios.
Software & Tools Used:
| Category | Software |
|---|---|
| GIS & Spatial Analysis | QGIS 4.0.1 |
| Hydraulic Modelling | LISFLood-FP 2.0 |
| Data Processing | Python (Anaconda) |
| Geospatial Libraries | Rasterio, Matplotlib, NumPy, Pillow |
| Video Generation | FFmpeg |
| Scripting | PowerShell, Batch (CMD) |
| Data Sources | LCDB v5.0 (Landcare Research), Regional DEM, Wetland Extent Maps |
