
This analysis was conducted using RStudio to explore the relationship between elevation, temperature, and Nothofagus fusca basal area at Woolshed Hill. Data from 13/03/20 to 03/07/20 were processed and visualized using statistical techniques in R. Elevation-based temperature trends were analyzed, and categorical site classifications (below, within, and above the wind throw) were assigned and color-coded (red, blue, and green, respectively). The mean minimum temperature at each elevation was calculated and plotted in orange to highlight temperature variation across the landscape.
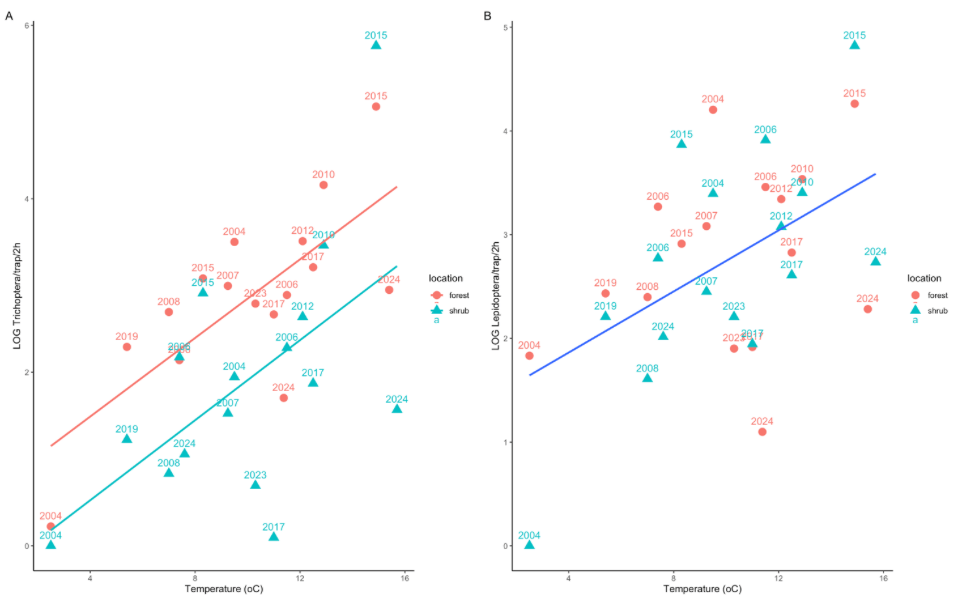
This analysis used RStudio to explore the relationship between species distribution and temperature, with data subset into forest and shrub environments. Statistical techniques, including correlation or regression, identified trends, while scatter plots visualized the results with color coding for clarity.

This analysis involved calculating the mean of the data and visualizing it alongside the confidence interval to illustrate the precision of the estimate. Using statistical methods in R, the mean was computed, and confidence intervals were calculated to quantify the uncertainty.
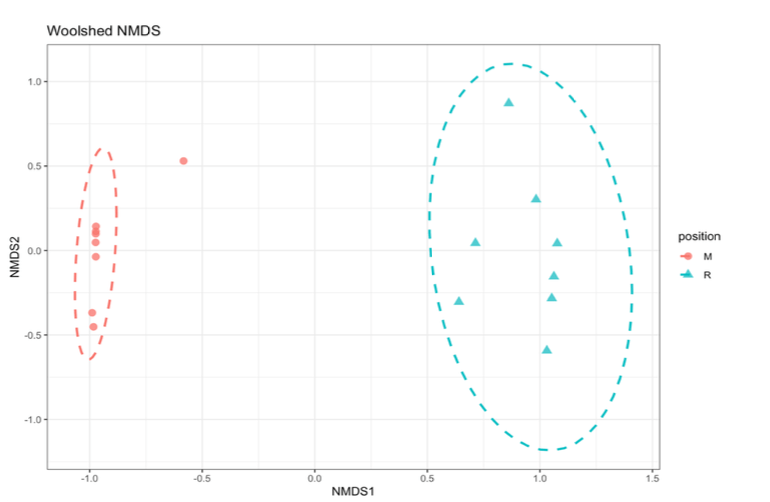
For the NMDS (Non-Metric Dimensional Scaling) ordination, a multivariate analysis was performed to explore the relationships between forests dominated by Nothofagus solandri (red) and Nothofagus fusca (blue)

The resulting model provides a method for predicting EOSS (End-of-sumer-snowline) in years when aerial imagery cannot be collected, while allowing comparison of temperature–snowline relationships across glaciers from both the eastern and western sides of the Southern Alps.
Glacier temperatures were estimated by adjusting measurements from the nearest weather station located on the same side of the mountain as each glacier, using the lapse-rate equation. EOSS was measured from aerial imagery.
